Nanoparticles almost never arrive in the form they are needed. Graphene sheets stack. Carbon nanotubes (CNTs) bundle. Metal oxide particles aggregate during synthesis, drying, or storage. The surface-area advantage that makes nanomaterials attractive — the reason a gram of graphene provides hundreds of square meters of active surface — is nullified the moment those particles clump together into micron-scale agglomerates. Re-dispersing them is not optional; it is a prerequisite for every downstream application from battery electrode manufacturing to nanocomposite research to biomedical contrast agents.
Ultrasonic deagglomeration is the dominant laboratory and industrial method for breaking up nanoparticle aggregates and creating stable dispersions. This guide explains the mechanism, the parameters that govern results, protocols for common nanomaterial classes, and how to select the right ultrasonic homogenizer for the task.
Key takeaways
- Nanoparticles agglomerate from van der Waals forces, destroying the surface-area advantage that makes them useful.
- Specify total energy dose in J/mL, not time, for reproducible dispersion across batches and instruments.
- Energy ranges: 50–200 J/mL loose agglomerates, 200–1000 J/mL most lab work, 1000–5000 J/mL graphene and CNTs.
- Amplitude scales by material: 20–40% fragile particles, 40–60% metal oxides, 60–80% carbon nanotubes and graphene.
- Targets for quality: DLS polydispersity below 0.2 and zeta potential above ±30 mV.
Why Nanoparticles Agglomerate — and Why Ultrasound Works
At the nanoscale, van der Waals attractive forces between particles become very large relative to the particles’ inertia. A 50 nm TiO₂ particle has such a high surface-to-mass ratio that electrostatic and van der Waals forces easily overcome gravity — the particles are effectively “sticky” and form agglomerates spontaneously unless surface charge or steric repulsion keeps them apart.
Conventional mixing methods (magnetic stirring, high-speed rotor-stator) generate shear forces at the macro scale — insufficient to penetrate and break apart nanoscale agglomerate clusters where cohesive forces operate over distances of nanometers. Ultrasonic cavitation is different:
- Bubble collapse generates localized pressure pulses of hundreds of bar at the microscale
- Liquid microjets formed by asymmetric collapse directly impact agglomerate surfaces at velocities approaching 100 m/s
- Acoustic streaming drives turbulent micro-mixing at the particle scale, continuously transporting de-aggregated particles away from the high-shear zone and bringing new agglomerates in
The practical result is that agglomerates with cohesive forces that shear mixers cannot overcome are broken apart efficiently, and the resulting primary particles are suspended in a state that surfactants and stabilizers can maintain.
Critical Process Parameters
Specific Energy Input (J/mL)
Tip: Set protocols by cumulative joules per mL shown in real-time, since amplitude, duty cycle, probe size, and volume all change effective energy.
The most reliable scaling parameter for nanoparticle dispersion is specific energy — the total acoustic energy delivered per unit volume of dispersion. It captures both amplitude, processing time, pulse duty cycle, and probe efficiency in a single number.
- Low energy (50–200 J/mL): Suitable for loose soft agglomerates (e.g., pre-dispersed metal oxide in water, low-concentration graphene)
- Medium energy (200–1000 J/mL): Most laboratory nanoparticle dispersions; CNT bundles, ZnO, TiO₂, SiO₂ at 0.1–5% loading
- High energy (1000–5000 J/mL): Graphene delamination from graphite flakes, highly entangled MWCNTs, high-viscosity electrode slurries
SONOBIO Split-Type instruments display total energy (Joules) in real time, enabling reproducible protocols defined by energy dose rather than time.
Amplitude (%)
Higher amplitude = more intense cavitation = more effective deagglomeration, but also more probe erosion and greater risk of over-processing fragile particles. For most nanomaterials:
- 20–40%: Fragile biological nanoparticles, gold nanoparticles, quantum dots
- 40–60%: Metal oxides (TiO₂, ZnO, Fe₃O₄, SiO₂), ceramic particles
- 60–80%: Carbon nanotubes, graphene, boron nitride, hard agglomerates in high-viscosity matrices
Pulse Mode
Note: Monitor temperature during sonication; most nanoparticles stay stable to 60–80°C but polymer-coated and biofunctionalized particles are more sensitive.
Continuous mode at high amplitude heats the sample rapidly. For most nanoparticle dispersions:
- 5 s on / 5 s off is a safe starting point
- Viscous slurries may benefit from shorter on-periods (3 s on / 7 s off) to allow thermal equilibration
- Temperature monitoring is essential; most nanoparticles are stable up to 60–80 °C, but polymer-coated particles and biofunctionalized nanoparticles may be more sensitive
Surfactant / Dispersant Selection
Ultrasonic energy alone disperses nanoparticles during processing but does not prevent re-agglomeration once sonication stops. A surfactant or dispersant must be present to stabilize the dispersed state:
| Nanomaterial | Common Dispersants |
|---|---|
| Graphene / rGO | NMP, pyrene-PEG, sodium cholate, Triton X-100 |
| CNT (SWCNT / MWCNT) | SDS, sodium cholate, carboxymethyl cellulose (CMC), Triton X-100 |
| TiO₂, ZnO, Al₂O₃ | Dispersant BYK-180, polyacrylic acid (PAA), citric acid |
| Fe₃O₄ (magnetic) | Oleic acid, CTAB, PEG-silane |
| Battery cathode (NCM, LFP) | NMP + PVDF binder (standard electrode formulation) |
| Gold / silver nanoparticles | PVP, PEG, citrate |
The dispersant should be added to the solvent before the nanoparticle powder is introduced, and the slurry briefly mixed before sonication begins.
Probe Diameter and Vessel Geometry
| Volume | Probe Diameter | Notes |
|---|---|---|
| 0.5–5 mL | Φ3–6 mm (microtip) | Highest intensity; use for precious nanomaterials |
| 5–100 mL | Φ9–12.7 mm | Standard lab probe; most dispersion work |
| 100 mL–2 L | Φ20 mm | Medium batch; electrode slurry at lab scale |
| 2–5 L | Φ25–30 mm | Large batch; pilot-scale slurry |
| 5–50 L | Φ40–50 mm | Industrial batch; 2000 W SONOBIO Industrial |
Position the probe tip approximately 1–2 cm below the liquid surface for best circulation.
Protocols for Common Nanomaterials
Protocol 1: Graphene (Exfoliated or rGO) Dispersion in Water or NMP
Goal: Stable single/few-layer graphene suspension at 0.1–5 mg/mL
Equipment: SONOBIO Split-Type, Φ12.7 mm probe; water bath temperature control
- Weigh graphene powder into vessel; add solvent containing dispersant (e.g., 0.5% sodium cholate in DI water, or NMP for non-aqueous)
- Pre-mix by magnetic stirring 5 minutes
- Amplitude: 60%; pulse 5 s on / 5 s off; ice bath
- Target energy: 500–2000 J/mL (monitor J readout on 7″ touchscreen)
- Allow to cool; characterize by DLS (Z-average, PDI) and Raman (D/G ratio for defect assessment)
- Centrifuge at 500–1000 × g for 10 minutes to remove any un-exfoliated graphite; collect supernatant
Note: Raman D/G ratio monitoring is important — extended high-amplitude sonication introduces basal plane defects in graphene. Balance dispersion quality vs. structural integrity.
Protocol 2: Multi-Wall Carbon Nanotube (MWCNT) Dispersion
Goal: Individualized MWCNTs in aqueous or polymer solution for composite fabrication
Equipment: SONOBIO Split-Type, Φ12.7–20 mm probe
- Disperse MWCNTs at 0.1–2% w/v in surfactant solution (1% SDS or sodium cholate in DI water; or CMC 0.5%)
- Pre-stir 15 minutes
- Amplitude: 65–75%; pulse 5 s on / 5 s off; maintain T < 40 °C with ice bath
- Process for 800–1500 J/mL total energy
- Optional: centrifuge at 5000 × g to remove large bundles; collect supernatant
- Characterize by UV-Vis (absorbance at 730 nm for SWCNT concentration), DLS, TEM
Protocol 3: TiO₂ or ZnO Nanoparticle Dispersion for Coatings / Photocatalysis
Goal: Stable suspension of metal oxide nanoparticles (20–100 nm primary size) at 1–20% loading
Equipment: SONOBIO Integrated-Type or Split-Type, Φ12.7–20 mm probe
- Add dispersant to vehicle first (e.g., BYK-180 at 1–3% w/w of oxide in water or ethanol)
- Slowly add nanoparticle powder under stirring; pre-mix 5 minutes
- Amplitude: 50%; pulse 5 s on / 5 s off
- Process for 200–500 J/mL
- Monitor particle size by DLS; target < 3× primary particle size (indicating small aggregates)
- If viscosity is high (>100 cP), increase amplitude to 60–70% and reduce batch size
Protocol 4: Battery Electrode Slurry (LFP / NCM Cathode)
Goal: Homogeneous dispersion of active material, carbon black (Super P), and PVDF binder in NMP for coating
Equipment: SONOBIO Split-Type (Φ20–30 mm) for lab scale; SONOBIO Industrial for production
- Dissolve PVDF in NMP first (12 hours, magnetic stirring)
- Add carbon black; mix 30 minutes
- Add LFP or NCM powder; mix 1 hour
- Sonicate: amplitude 55–65%; pulse 5 s on / 5 s off; maintain T < 50 °C
- Energy input: 300–800 J/mL
- Characterize by tape-casting a thin film onto aluminum foil; examine adhesion and surface quality
- Check impedance spectroscopy after cell assembly to confirm electrical contact improvement vs. stirring-only control
Protocol 5: Fe₃O₄ Magnetic Nanoparticles in Biological Buffer
Goal: Stable suspension of superparamagnetic iron oxide (SPION) for biomedical or water treatment use
Equipment: SONOBIO Non-Contact (8 sealed tubes) or SONOBIO Integrated-Type with Φ6 mm microtip
- Suspend Fe₃O₄ in PBS or DI water containing PEG-silane or citric acid stabilizer
- Amplitude: 30–40% (lower to preserve surface coating)
- Pulse: 3 s on / 7 s off; ice bath
- Energy: 100–300 J/mL
- Verify: DLS, zeta potential (target |ζ| > 30 mV for electrostatic stabilization), TEM
Industrial Scale: Battery Slurry and Graphene Ink Production
At production scale, nanoparticle dispersion by probe sonication requires reconfiguration:
- Large batch: SONOBIO Industrial 2000 W with Φ40 mm titanium probe handles up to 50 L per batch. The 24×7 duty rating means the unit can run continuous production shifts without cooling downtime.
- Continuous inline processing: The SONOBIO Industrial equipped with an inline flow cell pumps slurry through a sonication chamber at a controlled flow rate. This is the configuration of choice for graphene ink production, conductive slurry manufacturing, and any process where batch-to-batch consistency must be rigorously controlled. Each unit volume receives the same energy dose regardless of total production volume.
- High-viscosity slurries: SONOBIO Industrial’s Φ40 or Φ50 mm probe operates effectively in slurries up to several thousand centipoise — typical for concentrated battery electrode formulations that would cavitate poorly with smaller probes.
For reference: a SONOBIO Industrial unit has been used to disperse graphene in NMP (50 L, 1% loading) in under 45 minutes at 2000 W.
Monitoring Dispersion Quality
| Technique | What It Measures | Target | ||
|---|---|---|---|---|
| Dynamic Light Scattering (DLS) | Hydrodynamic diameter, PDI | < 3× primary particle size; PDI < 0.2 | ||
| Zeta Potential | Surface charge (electrostatic stability) | ζ | > 30 mV | |
| UV-Vis spectroscopy | Concentration of CNT/graphene in supernatant | Follows Beer-Lambert for known extinction coefficients | ||
| TEM / SEM | Visual confirmation of individualization | Primary particles visible, few large aggregates | ||
| Raman spectroscopy | Structural integrity of graphene / CNT | D/G ratio; low defect density preferred | ||
| Viscosity | Slurry homogeneity and processability | Consistent with formulation specification |
Selecting the Right SONOBIO Model
SONOBIO Handheld (120 W, 20 kHz)
For small-volume screening (0.3–500 mL), quick feasibility tests, or mobile use. Not suited for high-viscosity slurries or hard agglomerates requiring >500 J/mL. Useful for academic research requiring budget-friendly dispersion capability.
SONOBIO Integrated-Type (800 W, 25 kHz, 4.7″ touchscreen)
Core lab instrument for 0.5 mL–3 L dispersion tasks. Built-in sound enclosure is a major quality-of-life advantage for labs where noise is regulated. Temperature sensor option + automatic shutoff. Programmable 5-step programs for reproducible dispersion protocols across operators.
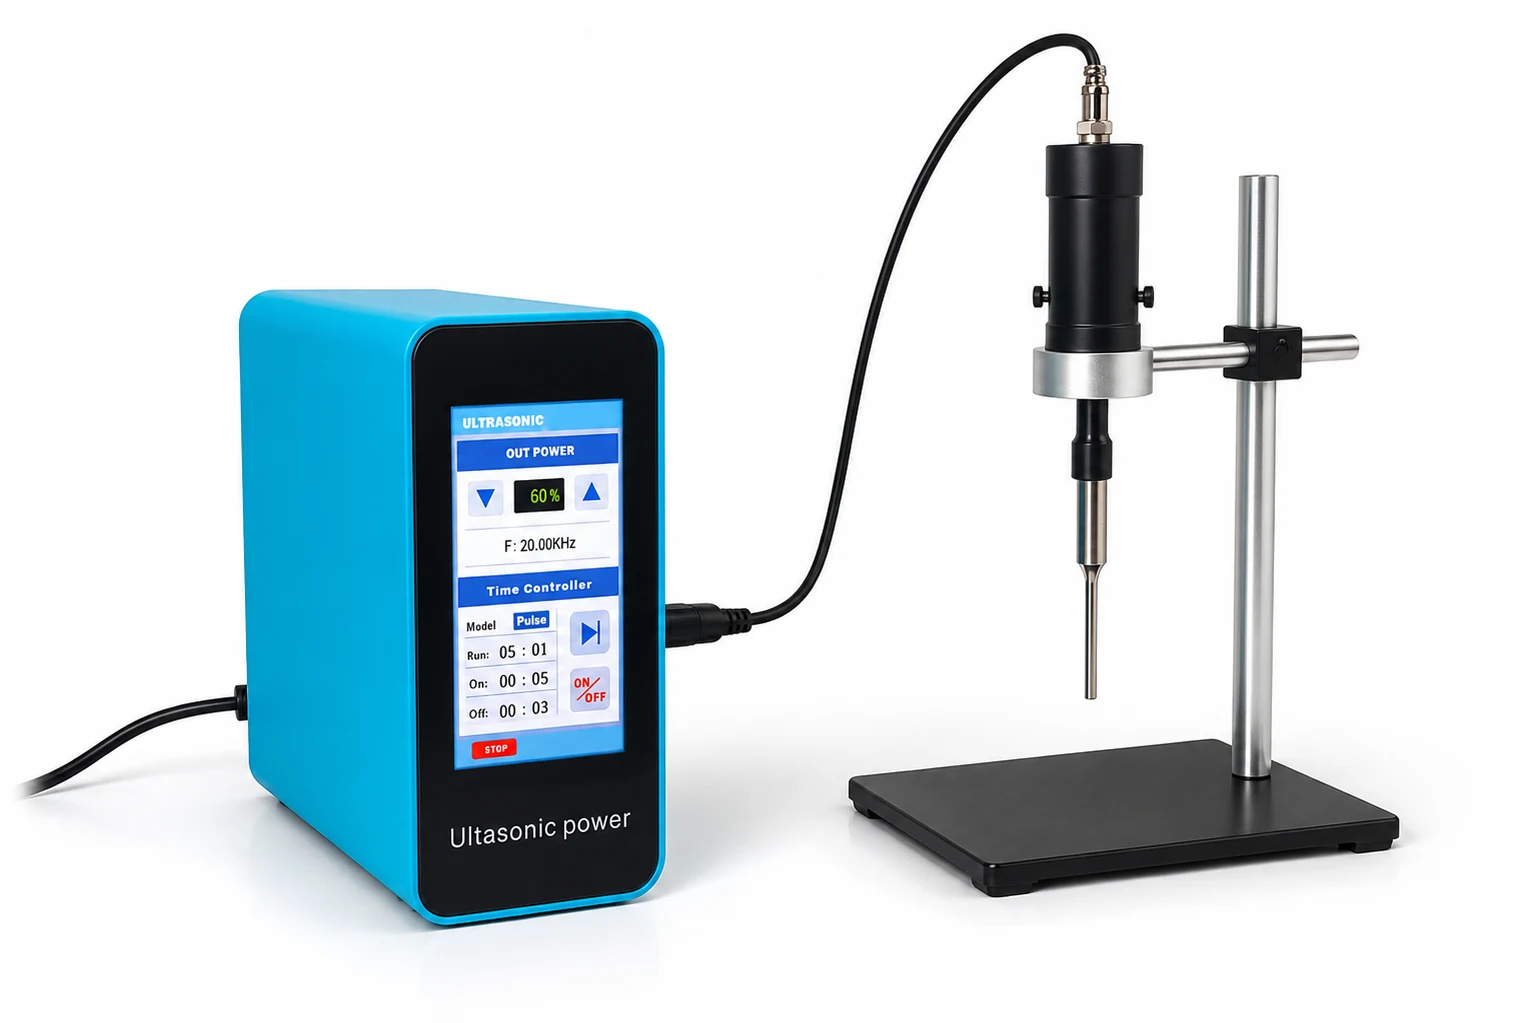
SONOBIO Split-Type (1200 W standard / 2000 W max, 20 kHz, 7″ touchscreen)
Most capable laboratory model. Handles 0.2 mL–5 L with the widest probe range (Φ3–30 mm). Real-time display of time, power, total energy (J), and temperature. Three operating modes (continuous, interval, pulse). Energy-dose programming is the most scientifically rigorous way to specify nanoparticle dispersion protocols across labs and scales.
SONOBIO Industrial (2000 W real power, 20 kHz)
For 5–50 L batch production and continuous inline processing. Φ40 or Φ50 mm titanium alloy probe. Flow cell configuration available for continuous production. 24×7 continuous duty rating. The production choice for battery materials, graphene ink, and industrial nano-coating manufacturers.
All SONOBIO models feature stepless amplitude control (1–100%), programmable pulse modes, CE certification, and 1-year instrument warranty. Probes are consumable items.
Frequently Asked Questions
How long does ultrasonic dispersion of CNTs take compared to stirring?
Magnetic stirring alone does not effectively de-bundle CNTs — it mixes but does not generate sufficient shear to break van der Waals cohesion between nanotubes. Probe sonication at 60–70% amplitude typically achieves effective MWCNT individualization within 10–30 minutes of active processing (accounting for pulse off-time). The same degree of de-bundling by stirring alone may take days to weeks and often remains incomplete.
Does sonication damage nanoparticles or reduce their properties?
This depends on the material and the processing intensity. CNT sidewalls and graphene basal planes can develop defects under extended high-amplitude sonication — monitor with Raman spectroscopy and use the minimum energy dose required. Metal oxide nanoparticles (TiO₂, ZnO) are generally robust at normal processing conditions. Fragile particles (quantum dots, gold nanostars) require careful amplitude control (20–35%). The rule: use the minimum amplitude and energy dose that achieves the target particle size.
What concentration of nanoparticles can I disperse?
Probe sonication works well up to 10–20% w/v for most metal oxides. At higher loadings, viscosity limits cavitation efficiency. For very high concentration slurries (>20% solids, as in battery electrode pastes), it is usually necessary to start dispersion at lower concentration and add the remaining solid incrementally during sonication. The SONOBIO Industrial handles high-viscosity electrode slurries at Φ40 mm probe diameter, where smaller probes would lose cavitation efficiency.
Can I use ultrasound to functionalize nanoparticles at the same time as dispersing them?
Yes — sonochemical surface modification during dispersion is a research-active technique. For example, ultrasonically assisted surface-functionalization of TiO₂ with silane coupling agents, or oxidative functionalization of CNT sidewalls in H₂SO₄/HNO₃ mixtures, is performed simultaneously with dispersion. These processes require appropriate chemical safety precautions and solvent-resistant probe materials (standard titanium alloy is compatible with dilute acids and common organic solvents).
How do I reproduce a dispersion protocol across different batches or instruments?
Use total energy dose (J/mL) rather than time as your primary protocol parameter. Because amplitude, pulse duty cycle, probe diameter, and batch volume all affect the effective energy per unit volume, specifying J/mL directly is more reproducible than specifying “5 minutes at 60% amplitude.” SONOBIO Split-Type and Industrial models display cumulative energy in joules in real time; program the target dose and stop when reached.
Request a Quote
Related posts


Popular products
-
 Anillo piezocerámico Φ69~Φ70mm
$20.00
Anillo piezocerámico Φ69~Φ70mm
$20.00
-
28kHz 600Watt F25-SA-1
Original price was: $220.00.$184.00Current price is: $184.00.
-
 SONOBIO 30L Ultrasonic Homogenizer Double-Layer Glass Reactor
Original price was: $10,000.00.$7,000.00Current price is: $7,000.00.
SONOBIO 30L Ultrasonic Homogenizer Double-Layer Glass Reactor
Original price was: $10,000.00.$7,000.00Current price is: $7,000.00.
-
15kHz 2600Watt Generador ultrasónico
Original price was: $960.00.$800.00Current price is: $800.00.
-
40kHz 800Watt F25ST1
Original price was: $250.00.$220.00Current price is: $220.00.
-
Anillo piezocerámico Φ55mm
Original price was: $14.00.$11.50Current price is: $11.50.
-
Anillo piezocerámico Φ38mm
Original price was: $6.00.$5.00Current price is: $5.00.
-
TelSonic Replacement 20kHz 3200Watt
Original price was: $390.00.$350.00Current price is: $350.00.
-
 20kHz 2000Watt Spot Welding Set
Original price was: $300.00.$260.00Current price is: $260.00.
20kHz 2000Watt Spot Welding Set
Original price was: $300.00.$260.00Current price is: $260.00.
-
35kHz 900Watt F30-SA-P
Original price was: $250.00.$207.00Current price is: $207.00.
-
TelSonic Replacement 20kHz 4500Watt
Original price was: $390.00.$350.00Current price is: $350.00.
-
Weber 35kHz 1200watt Replacement
Original price was: $280.00.$250.00Current price is: $250.00.
-
Anillo piezocerámico Φ45~Φ49mm
Price range: $5.00 through $9.50
-
28kHz 600Watt F30-SA-1
Original price was: $208.00.$184.00Current price is: $184.00.
-
20kHz Booster; Gain 1:3
Original price was: $180.00.$165.00Current price is: $165.00.